


Written by Andrew light
This article on sustainability finance for the aviation sector examines the subject from the perspective of the main banks who provide aviation finance to airlines and aircraft lessors. It follows on from a previous article on an overview of sustainable aviation finance. Knowing how banks target and monitor their financed and facilitated emissions and make climate risk assessments of their corporate clients could enable airlines and lessors to secure financings at lower rates and on more favourable terms and allow access to sustainability-linked finance on even better terms.
Summary
The financed and facilitated emissions of banks make up almost all of their overall carbon footprints, exceeding the emissions of their own operations and supply chain by a factor of over 50 times. Most major banks therefore take their financed and facilitated emissions very seriously and have specific targets and plans for each hard to abate sector, including aviation. Aviation itself typically accounts for 2-5% of a large corporate bank’s financed and facilitated emissions.
Many banks have been voluntarily monitoring and reporting their financed emissions since the Paris Agreement was signed in 2015, culminating in the formation of the Net Zero Banking Alliance (NZBA) under the auspices of the United Nations in 2021, to which 140 banks had signed up by 2024. Under growing political, legal and greenwashing pressure, however, the NZBA closed in October 2025 after 15 major banks decided to withdraw.
Most major banks remain committed to net zero in their financed and facilitated emissions, despite the ending of the NZBA. The guidelines, resources and tools that NZBA has developed are valuable, remain valid and continue to be used by most large banks worldwide to frame their decarbonisation efforts. They are now owned by the United Nations Environment Protection Finance Initiative (UNEPFI).
Despite a lull in sustainable aviation finance transactions in 2025 compared to previous years (see this article Sustainable Finance for Airlines – Poised to Rebound?) the banking sector’s aggressive sustainable finance volume targets for 2030 support renewed sustainable financing to the aviation sector in the form of sustainability-linked loans for general purposes and transition finance for sustainable aviation fuel (SAF) projects.
Banks rarely restrict lending to aviation on environmental grounds, unlike for fossil fuel production. For high-emitting sectors, like aviation, major banks have physical carbon intensity reduction targets for 2030, mainly expressed in terms of grams of CO2e per RTK (revenue tonne kilometre) for aviation, based on science-based pathways to net zero emissions by 2050. An increasing number of banks are monitoring their aviation carbon intensity and targeting an average reduction of 18% compared to 2023 based on a sample of 24 banks. This reduction is broadly consistent with 2030 targets of listed major airline groups.
In addition to the UNEPFI resources and guidelines, banks make use of sector-specific scenarios, frameworks and tools in targeting their carbon intensity and measuring the climate alignment of their portfolios to these targets, including the Mission Possible Partnership (MPP) ‘Prudent’ (PRU) scenario and the Pegasus Guidelines in the aviation sector.
Banks typically make climate risk assessments of their corporate clients and assign customer scores to help them steer their aviation portfolios towards their emission goals, to target and engage with clients and to set risk appetite limits on how much business they can do in high emitting sectors.
These climate risk assessments and customer scores are based most importantly on evidence of a client’s emissions reporting, interim 2030 targets and specific action plans to achieve these targets. Commitment to net zero emissions by 2050, the integration of climate change into strategic planning and good governance structures and processes are also important but are secondary to emissions reporting, 2030 targets and action plans.
Generally, airlines and lessors must demonstrate commitment to these requirements to their banks in order to score highly and attract favourable financing terms, even though they may not yet necessarily have them all in place today. Further, achieving a high customer score could unlock access by airlines and lessors to sustainability-linked loans and facilities on even better terms than regular aviation finance. Banks offer sustainability-linked loans because of their direct linkage to carbon intensity targets, unlike regular loans.
To access sustainability-linked financing at attractive rates and terms, best practice is for airlines and lessors to develop a Sustainable Finance Framework. This framework should explain the rationale for financing, the company’s adherence to sustainability principles, the linkages of proposed financing terms to sustainability performance targets (SPTs) and their processes for emissions measurement, reporting and verification. There is a useful checklist at the end of this article (Figure 8) that can help airlines and lessors develop a Sustainable Finance Framework.
Companies with listed shares and bonds under most major stock exchange regulations are compelled to report on their sustainability performance. Even if their shares or bonds are not publicly listed, airlines and lessors are encouraged to make public their climate commitments, targets, performance and plans on their websites and in their annual reports and financial statements.
History of banks aligning their lending activities to climate goals
Banks globally have been voluntarily adhering to environmental and social goals and monitoring the environmental and social risks of their loan portfolios ever since 2003 when the original ‘Equator Principles’ risk management framework was agreed and adopted by several international financial institutions for project financings and bridge loans. These principles are still in existence, having been updated several times and adopted by 138 financial institutions worldwide.
Banks first started to measure and monitor their financed greenhouse gas (GHG) emissions across their wider financing portfolios with the establishment by 14 Dutch banks of the Partnership for Carbon Accounting Financials (PCAF) in 2015, the same year that the Paris Agreement was adopted at the COP21 Climate Change Conference. PCAF was enlarged and went global with the launch by 33 banks of the Collective Commitment to Climate Action (CCAF) initiative in 2019. CCAF required its members to establish climate goals for 2050 and 2030 for their financed emissions (Scope 3, Category 15) by 2022, using 2019 as the baseline year.
This led to the founding of the Net Zero Banking Alliance (NZBA) in 2021 as one of several voluntary financial groupings that gathered under the Glasgow Financial Alliance for Net Zero (GFANZ) at the COP26 climate conference in that year.
The GFANZ and its subsidiary groups were formed in order to support the goal of the Paris Agreement to limit global temperature to 1.5 degrees and to provide tools and resources to the financial services sector to implement its net zero goal by 2050 and interim climate commitments by 2030. At its peak in 2024, NZBA had 140 members representing 40% of global banking assets.
Following the election of the Trump Administration in November 2024, however, six major US banks (Bank of America, Citigroup, Goldman Sachs, JP Morgan Chase, Morgan Stanley and Wells Fargo) withdrew from the NZBA by early January 2025. While not providing explicit reasons for their exits, media consensus was that the banks’ motives for leaving were concerns over increased political, legal and greenwashing scrutiny.
The US withdrawals were followed by the departures of five Canadian banks and an Australian bank in the first quarter of 2025 for similar reasons. In order to prevent further departures, NZBA members voted in April 2025 to relax its climate commitments from ‘mandatory’ requirements to ‘recommended’ suggestions. But this only served to anger some other lenders, such as Triodos Bank, an ethical bank based in the Netherlands. In addition, three other European-based global banks (Barclays, HSBC and UBS) left the alliance in the summer of 2025. In October 2025, the remaining NZBA members voted to stop operations and transform NZBA to a framework of guidelines, resources and tools.
The Bankers Association for Finance and Trade (BAFT), a global transaction banking association, summed up these events very well when it said in a media appearance that NZBA folded because of the impossibility of creating single standards for the global banking sector that are sufficiently flexible to accommodate regional differences in banks’ operating models, regulatory environments and sustainability goals.
By October 2025, NZBA had already developed significant quantities of guidelines, resources and tools. These still remain in place to help banks target and monitor their financed and facilitated emissions. They can be found on the United Nations Environment Programme Finance Initiative (UNEPFI) website.
Most major banks remain committed to Net Zero by 2050
Despite the NZBA ending operations, most major banks remain committed to and continue to report on their climate objectives, as shown in Figure 1. This table examines the extent to which the 15 major banks, who withdrew from the NZBA in 2024 and 2025 before its formal closure, have retained their climate targets.
Of these 15 banks, nine have since publicly committed to net zero emissions for their financing activities by 2050, 12 have retained their interim targets for 2030, 12 have targets for sustainable financing volumes by 2030 and seven have specific carbon intensity targets by 2030 for their aviation financing activities. All of them have retained net zero targets for their own Scope 1 and 2 operations, although these emissions are tiny in relation to their financed emissions and are relatively easy to achieve. Most of the banks in Figure 1 have published sustainability-related reports or statements since the ending of the NZBA in October 2025.
Of the six banks that have not reiterated their financing net zero targets for 2050, only two have formally dropped all of their financing emission targets – Scotiabank and Wells Fargo. The others who had previous net zero financing targets, such as Bank of Montreal, Goldman Sachs and JP Morgan Chase, have just not mentioned a net zero commitment in their most recent Sustainability Reports. But they still retain their 2030 carbon intensity targets for their most emitting sectors (e.g. oil and gas, power generation and aviation), which are based on science-based sector pathways to net zero by 2050. Of these 15 banks, seven have aviation emission targets and eight do not. Six of these eight banks did not have aviation emission targets before and were not major lenders to the sector.
In summary, the global banking sector overall remains committed to net zero by 2050, as well as to sector-specific interim targets for 2030. Most of the world’s major banks continue to monitor and report on the emissions of their own operations and those of their financing activities.
Figure 1. Current climate targets of major banks as of April 2026 that withdrew early from NZBA in 2024 and 2025
| Bank | Financing Net Zero 2050? | 2030 Target? | Sustainable Finance? | Aviation Target? | Latest Publication | Date |
| Bank of America | Yes | Yes | Yes | Yes | Sustainability Report | Dec 2025 |
| Bank of Montreal | No | Yes | No | No | Sustainability Report | Mar 2026 |
| Barclays Bank | Yes | Yes | Yes | Yes | Sustainability Presentation | Feb 2026 |
| CIBC | Yes | Yes | Yes | No | Sustainability Report | Mar 2026 |
| Citigroup | Yes | Yes | Yes | Yes | Sustainable Finance Framework | Dec 2025 |
| Goldman Sachs | No | No | Yes | No | 2025 Annual Report | Feb 2026 |
| HSBC | Yes | Yes | Yes | Yes | 2025 Annual Report | Feb 2026 |
| JP Morgan Chase | No | Yes | Yes | Yes | Sustainability Report | Oct 2025 |
| Macquarie | Yes | Yes | No | No | Sustainability Report | Mar 2025 |
| Morgan Stanley | Yes | Yes | Yes | Yes | Sustainability Report | Nov 2025 |
| RBC | Yes | Yes | Yes | No | Sustainability Report | Oct 2025 |
| Scotiabank | No | No | Yes | No | Sustainability Report | Dec 2025 |
| TD Bank | No | Yes | Yes | Yes | Sustainability Report | Mar 2026 |
| UBS | Yes | Yes | No | No | Sustainability Report | Mar 2026 |
| Wells Fargo | No | No | Yes | No | Website | Feb 2025 |
Source: Company reports and websites.
Decarbonisation guidelines for banks
The NZBA guidelines for climate target-setting remain available for banks to use as a framework for decarbonisation. They are now part of the UNEPFI the latest version of which is contained in this UNEPFI link and can be found on the www.unepfi.org website.
These decarbonisation guidelines include the following 12 recommendations:
- Banks’ emission targets should align with those of the Paris Agreement to limit global warming to well below 2oC, preferably to 1.5oC, above pre-industrial levels.
- Targets should cover absolute emissions as well as emissions intensity.
- Targets should be science-based.
- Banks’ emission targets should include their own Scopes 1, 2 and 3 (upstream supply chain) emissions and also the financed and facilitated emissions of their lending clients (Scope 3, Category 15).
- Targets should address a ‘significant majority’ of emissions financed and facilitated by banks.
- Banks should establish an emissions baseline year but no more than two years prior to setting the targets.
- Targets should be set for 2050 and for 2030 and subsequent 5-year interim targets should be set, for example, 2035 targets should be set by 2030 and 2040 targets by 2035 and so on.
- Specific targets should be set for high-emitting sectors, which can include automotive, aviation, shipping and other transportation modes as well as the highest emitting sectors – oil and gas production and power generation.
- Targets should be based on gross emissions with offsetting carbon credits limited only to carbon removal (i.e. ETS and CORSIA credits in aviation are excluded but carbon removal and sequestration investments are included).
- Banks should publish a high-level transition plan to achieve their targets, including for each of the high-emitting sectors.
- Targets and transition plans should be verified by a third-party assurer.
- Banks should offer products and services (i.e. sustainable financing) that support and incentivise their clients’ transition plans.
The main differences in these principles compared to NZBA’s original ones in 2021 are that they are recommendations rather than mandatory requirements and that banks no longer have to ‘comply or explain’ where they do not comply with them.
Banks’ decarbonisation targets
Typically, major banks have committed to net zero emissions in their direct operations by between 2025 and 2030 and to net zero emissions in their financing operations by 2050. Here is an example of Barclays’ approach to climate transition, published in July 2025.
Most major banks have four types of sustainability targets:
- Sustainable finance volume.
- Lending restrictions to fossil fuel expansion and anti-social activities.
- Direct emissions reduction of their own operations and their supply chain (e.g. business travel).
- Financed and facilitated emissions reduction.
- Sustainable finance volume
The first target concerns the quantity of finance provided directly to fund sustainability purposes. Deutsche Bank, for example, in 2020 targeted an amount of €900 billion (c.US$1 trillion) by 2030 and had accumulated €471 billion as of the end of 2025, in line with its previous target for €500 billion for 2025. Barclays Bank in 2022 targeted US$1 trillion of sustainable and transition financing between 2023 and 2030. Citigroup, Morgan Stanley and many other US and European banks also have US$1 trillion sustainable finance by 2030 goals, broadly split evenly between environmental and social purposes, and JP Morgan Chase has a US$1 trillion climate change finance target by 2030.
As of the end of 2025, many banks were not even half-way to achieving their 2030 targets, implying significantly more sustainable financing to come.
Despite a reduction in sustainable aviation finance transactions in 2025 compared to previous years, as described in the article Sustainable Finance for Airlines – Poised to Rebound?, banks’ ambitious sustainable finance volume targets are good news for the aviation sector. In their most recent sustainability reports, many banks have discussed boosting their investments in and lending to sustainable aviation fuel (SAF) and carbon removal projects.
As a reminder, sustainable finance includes three main categories:
- Green and social finance. These are ‘use of proceeds’ financing, sustainable bonds and loans to finance a specific project or projects that have a positive contribution to sustainability or at least a neutral impact should the borrower already be sustainable. For green finance, projects must be zero or negative emitting. Emission reduction uses, such as a SAF project, are not eligible under the green category. This is why green financings are rare in the aviation sector. Carbon removal projects would qualify.
- Sustainability-linked finance. These funds can be used for general corporate purposes and are not necessarily tied to specific projects or purchases. But the financial terms and/or interest rate are linked to the sustainability performance targets (SPTs) of the borrower. This is the most common type of sustainable financing in the aviation sector, in particular sustainability-linked loans and credit facilities with links to airline carbon intensity targets.
- Transition finance. This financing sits somewhere in between sustainable financing and sustainability-linked financing. Transition finance is typically used in high-emitting industries to fund transition to a low but not necessarily a zero-carbon environment. Financings do not necessarily have an interest rate or lending terms linked to a sustainability objective. A SAF project would quality for transition finance.
Barclays Bank, for example, had 43% of its new sustainable financing in 2025 as green finance. 41% went to social finance, involving lending mainly to supranational, national and regional development institutions. 12% was for sustainability-linked financing and 4% for transition financing. In total, 59% of sustainable financing went to environmental purposes and 41% to social purposes in 2025.
How individual bank targets for sustainable finance volume are arrived at is not clear. They seem to be stakes in the ground with headline grabbing numbers, such as ‘US$1 trillion by 2030’ being the most common among the largest global banks. Overall global sustainable finance issuance was around 7% of total debt issuance in 2025.
Barclays’ sustainable finance volume has totalled US$260.7 billion since 2023 up to the end of 2025, equivalent to 23% of total financing assets (debt and equity) of US$1.16 trillion. It funded US$67.7 million of sustainable finance in 2023, US$94.5 million in 2024 and US$98.5 million in 2025. To meet its target of US$1 trillion by 2030, it will need to step up its annual new sustainable financing to c.US$150 million on average over the next five years, implying a significant acceleration to meet its target.
Some banks have set out more specific climate financing targets. Bank of America, for example, said in 2022 that it was committed to supporting the production of 1 billion gallons of sustainable aviation fuel (SAF) by 2030 through financing and investment.
- Lending restrictions to fossil fuel expansion and anti-social activities
Many banks restrict lending to high emitting sectors, especially to oil, gas, thermal coal and oil sands projects. Many banks outside the US have reduced their direct lending to these activities, especially for expansion projects and new oil and gas fields, and have targets to phase out these activities in the future, in particular for coal and oil shale activities. Other activities typically restricted by banks include adult entertainment, gambling, industrial-scale livestock production, predatory lending and tobacco.
Explicit lending restrictions on environmental grounds by major banks to aviation, however, are rare, even though they may have internal credit exposure limits to the sector, which is good practice.
- Direct emissions of operations
The direct emissions of banks are relatively small. Some banks have already claimed net zero achievement by 2025 while others typically target net zero by 2030. Scope 1 emissions are mainly from company vehicles and Scope 2 emissions are mainly from electricity generation for use at bank branches, office buildings and data centres. Scope 3 emissions, excluding financed emissions, relate mainly to purchases of products and services, leased assets, waste, employee commuting and business travel. Net zero direct Scope 1 and 2 emissions of banks are achieved by 100% use of renewable energy for a bank’s electricity requirements and 100% use of electric vehicles. Achieving net zero Scope 3 emissions is less straight forward and depends critically on suppliers to reduce their own emissions.
In the case of business travel, a bank’s emissions are typically offset by purchased carbon credits or purchases of sustainable aviation fuel (SAF) for their airline suppliers. Bank of America, for example, committed in 2022 to using SAF for at least 20% of its annual corporate and commercial jet fuel usage by 2030. This is higher than most airlines’ SAF commitment for 2030, which are typically between 5% and 10% of jet fuel needs, and is equivalent to 100% of Bank of America’s corporate jet fuel requirements for its use of business jets expected in 2030.
Figure 2. Carbon footprint of Deutsche Bank, 2025 (Tonnes of CO2e)
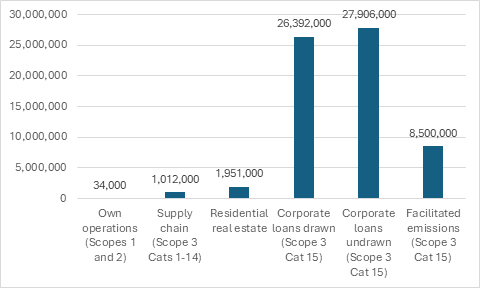
Note: Scope 13 Category 15 emissions are the Scope 1 and Scope 2 emissions of corporate customers. Source: Deutsche Bank Annual Report, 2025.
- Financed and facilitated emissions
Financed and facilitated emissions are known as Scope 3 Category 15 (investments) emissions. Financed emissions are those generated as a result of a bank’s on-balance sheet financing of customers via equity and bond investments, drawn and undrawn credit facilities, loans, mortgages and leases. Facilitated emissions refer to investment banking activities, including mergers and acquisitions advisory and the capital markets activities for equity, debt and syndicated loans. They apply when a bank does not necessarily itself provide capital to a customer but instead arranges their financing and execution. Facilitated emissions are based on the transaction flow each year, whereas financed emissions are based on the outstanding amount of financing at the end of each financial year.
Financed and facilitated emissions are by far the largest source of a bank’s emissions. Deutsche Bank, for example, reported that it financed 54.3 million tonnes of corporate customers’ CO2e emissions (Scopes 1 and 2) in 2025, compared to its own Scope 1 and 2 emissions of just 34,000 tonnes and its own physical supply chain Scope 3 emissions of 1.0 million tonnes (see Figure 2). In addition, Deutsche Bank facilitates 8.5 million tonnes of CO2e emissions (Scope 1 and 2) by arranging capital market transactions and performing other advisory activities. These emissions exclude Deutsche Bank’s corporate customers’ own Scope 3 supply chain emissions, which would have been higher by a factor of six times their Scopes 1 and 2 emissions.
The financed and facilitated emissions of Deutsche Bank in 2025 were more than the total emissions of a large airline group. Lufthansa Group, for example, generated 45.4 million tonnes of CO2e emissions in 2025 (29.8 million Scopes 1 and 2 and 15.6 million Scope 3).
The largest contributors to a bank’s financed and facilitated emissions tend to be in the energy and power generation sectors. At Deutsche Bank, for example, these sectors accounted for 39% of the bank’s emissions associated with its committed corporate lending exposure at the end of 2025 (see Figure 3). But these sectors accounted for only 10% of the bank’s overall committed corporate lending, excluding financial services and real estate lending.
Figure 3. Deutsche Bank – financed corporate emissions, committed lending exposure and lending carbon intensity by sector, 2025
| Sector | Emissions (Scopes 1 +2 ) | Committed Lending | Lending Intensity | ||
| MT CO2e | % Emissions | Euro (bn) | % Exposure | MT CO2e per Euro m | |
| Automotive | 1.6 | 3% | 16.8 | 6% | 95 |
| Aviation | 1.5 | 3% | 1.8 | 1% | 833 |
| Cement | 0.5 | 1% | 0.4 | 0% | 1,250 |
| Chemicals | 2.7 | 5% | 10.0 | 4% | 270 |
| Coal Mining | 0.8 | 1% | 1.2 | 0% | 667 |
| Conglomerate | 1.3 | 2% | 4.9 | 2% | 265 |
| Construction | 2.2 | 4% | 8.6 | 3% | 256 |
| Consumer Goods | 3.7 | 6% | 26.8 | 10% | 138 |
| Manufacturing | 3.2 | 5% | 25.8 | 9% | 124 |
| Metals & Mining | 1.7 | 3% | 4.3 | 2% | 395 |
| Oil and Gas | 10.6 | 18% | 14.8 | 5% | 716 |
| Power | 12.3 | 21% | 12.8 | 5% | 961 |
| Retail | 0.6 | 1% | 18.7 | 7% | 32 |
| Shipping | 1.5 | 3% | 0.9 | 0% | 1,667 |
| Steel | 2.0 | 3% | 1.8 | 1% | 1,111 |
| Utilities | 2.2 | 4% | 3.2 | 1% | 688 |
| Other Sectors | 6.0 | 10% | 124.1 | 45% | 48 |
| Total | 54.3 | 100% | 277.0 | 100% | 196 |
Source: Deutsche Bank Annual Report 2025. Note aviation and shipping figures based on 2024 data. Excludes lending to financial services, insurance, real estate and retail customers. Total gross loans in 2025 were Euro 499.3 billion.
Aviation lending for most banks is relatively small but the sector generates a high amount of emissions relative to total lending. The sector is also a relatively high growth sector, implying that aviation’s proportion of a bank’s total financed emissions could increase over time, especially as they reduce their exposures to fossil fuel production and other easier-to-abate sectors. At Deutsche Bank, aviation accounts for only 1% of its total committed lending but aviation drives 3% of its financed emissions. Carbon intensity of its lending to the aviation sector was 833 MT CO2e per million Euros committed, more than four times higher than the bank’s average of 196 MT CO2e per million Euros. Aviation is not the most carbon intensive sector in terms of lending. More intense sectors include cement, power generation, shipping and steel.
Banks tend not to have published absolute emission targets for their overall financed and facilitated emissions, except broadly to be financing total net zero emissions by 2050. They generally do not have an overall financed and facilitated emissions target for 2030, neither absolute emissions nor overall financing carbon intensity. The exception is Lloyds Bank, who targets a 50% reduction in absolute financed emissions by 2030 compared to a baseline of 29.2 MtCO2e in 2018. It had achieved a 36% reduction as of the end of 2024.
Many banks do, however, have specific targets for their 9 to 12 highest emitting customer sectors, which typically account for 65% to 75% of their total financed and facilitated emissions. The focus of targets for these sectors is mainly on physical carbon intensity and not absolute emissions.
The main exception to this is the upstream energy sector (production of coal, oil, gas and natural gas liquids), where most banks set an absolute emission reduction of typically 20-50% by 2030 compared to a 2020 baseline. This is because many banks have committed to curtail new funding towards fossil fuels but not to other large sectors.
Other high-emitting sectors that banks typically set carbon intensity targets for include power generation utilities, cement, iron and steel, aluminium, automotive manufacturing, livestock agriculture, housing and real estate. In transportation, the most common sectors for banks to have carbon intensity targets are aviation and shipping.
Each of these sectors have different measures of carbon intensity based on the convention in each sector, such as kgCO2e per MWh in the power generation sector and tonnes of CO2e per tonne of output in the cement and steel sectors. Each of these sectors also has a unique pathway or set of pathways to net zero emissions by 2050 with unique interim targets for 2030 based on realistic but ambitious scenarios for each sector. Banks set their sector emission intensity targets based on these industry pathways and scenarios and annually monitor and report the alignment of their loan and investment portfolio in each sector pathway. A common source of these sector pathways and scenarios is the International Energy Agency (IEA) Net Zero Emissions (NZE) by 2050 scenario (IEA NZE 2050).
A good example of how a bank monitors its alignment of its financed emissions is Barclays Bank’s BlueTrack™ dashboard that it displays in the climate and sustainability report section of its annual report. Figure 4 below contains the dashboard from its 2025 annual report, which shows its performance by sector as of the end of 2024 for each of its nine highest-emitting customer segments. It shows 2024 data and not 2025 data because banks do not receive emissions data from their clients until well after the year end and after the bank has produced its own annual and sustainability reports.
Figure 4. Barclays Bank BlueTrack™ dashboard
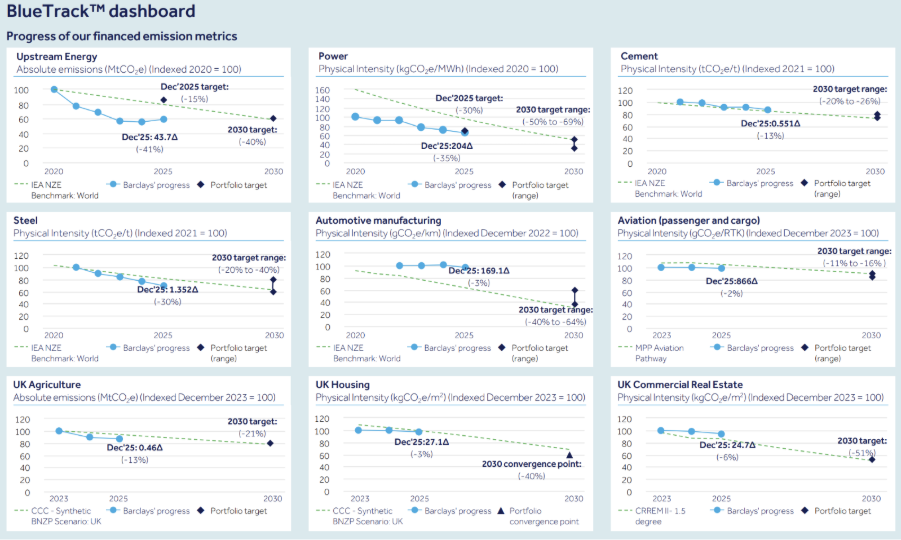
Source: Barclays Bank PLC Annual Report 2025
Estimating a bank’s financed and facilitated emissions
Banks estimate their share of customers’ emissions based on Partnership Carbon Accounting Financials (PCAF)’s GHG Accounting Standard, which defines how financial institutions should account for their Scope 3 Category 15 emissions.
PCAF distinguishes between financed emissions and facilitated emissions:
- Financed emissions. It is relatively straight forward to estimate a bank’s share of a customer’s emissions, assuming that they are disclosed. Essentially, a bank estimates its share of a customer’s emissions based on the finance value relative to the customer’s Enterprise Value including Cash (EVIC). EVIC is based on equity value plus gross debt. Many banks prefer to use the market value of equity if the customer has listed shares rather than using book value. This is because book values can often be negative due to net income losses and they can be distorted, for example by marking to market multi-year hedge portfolios and foreign currency balance sheet liabilities. For unlisted companies, banks have to calculate EVIC based on book values. If equity and debt figures are not available, banks must use ‘Total Assets’ as a proxy for EVIC on the basis that, by definition, total assets equal total liabilities plus equity. For project financings, a bank should base its financed emissions on its share of the specific emissions of the project, if they can be estimated, rather than on the customer’s total emissions.
A debate regarding financed emissions concerns the treatment of undrawn credit facilities and contingent liabilities. Only drawn credit facilities appear on a borrower’s balance sheet while undrawn facilities and contingent liabilities do not, although they are usually disclosed in notes to the financial statements. Undrawn facilities and contingent liabilities are therefore not theoretically part of an EVIC calculation and PCAF recommends excluding them. However, undrawn facilities are an important source of standby liquidity for corporate customers and they are typically much larger than or similar in magnitude to drawn facilities (see Deutsche Bank in Figure 2). In addition, many bank loans start out as undrawn credit facilities once they have been agreed but before drawdown has taken place. Some banks exclude undrawn facilities and contingent liabilities, as suggested by PCAF, but many include them, such as Barclays and Deutsche Bank. For those that include them, EVIC is effectively equity plus gross debt plus undrawn facilities plus contingent liabilities.
- Facilitated emissions. A bank’s facilitated emissions are based on its share of arranging and/or underwriting among the group of banks involved in a transaction. A bank’s share of facilitated emissions is calculated by dividing its share of the transaction value with a customer by the customer’s EVIC. Individual transaction values and their arranging banks can be sourced from finance data platforms, such as Bloomberg and Dealogic.
PCAF recommends that financial institutions apply a weighting factor to their share of the facilitated emissions of each transaction to account for the fact that it only helped arrange or helped underwrite the transaction rather provided its own capital over a period of time, unless of course any underwriting is exercised. If it had provided its own capital, as in a straightforward loan, the weighting factor is effectively 100%. Many banks, such as Citigroup and HSBC, apply a 33% weighting factor to their share of a transaction’s facilitated emissions.
Financed and facilitated emissions of sustainable financings
By definition, any green financing or arranging provided by a bank has zero emissions associated with the amount of the financing, given that green finance can only support zero or negative emitting activities. Sustainability-linked and transition financing do not enable zero emissions (they just enable emissions reduction) and should be recorded like other non-green financings. In theory, the emissions associated with sustainability-linked and transition financings should decline over time, assuming they help achieve their objectives for clients.
Emissions data quality
When banks report their financed and facilitated emissions, they should also report a PCAF Data Quality Score (PDQS) for the overall portfolio and for each major sector portfolio, such as aviation. The PDQS is a weighted average score for all of its financed and facilitated emissions between 1 and 5 with 1 indicating the highest quality score and 5 the least quality score. The PDQS varies according to the source of the emissions data, the extent of estimating that has been undertaken and the extent to which the data has been verified by a third party. Scores from 1 to 5 are based on these guidelines:
- Verified emissions data reported by the bank’s customer.
- Unverified emissions data reported by the customer.
- Estimated emissions data from customer production data (e.g. Revenue tonne kilometres of each aircraft type) and physical emission intensity factors based on third-party vendors or the customer’s own historical data (e.g. gCO2e per RTK for each aircraft type).
- Estimated emissions data from customer revenue data and sector-based emissions revenue intensity factors from third-party vendors.
- Estimated emissions data based on asset intensity estimates from third-party vendors (e.g. average annual emissions for each aircraft type applied to an airline’s or lessor’s total fleet).
The PDQS score of a bank’s total financed emissions is typically around 4.0. Deutsche Banks’s overall score was 4.2 in both 2024 and 2025. Barclays was slightly better with an overall score of 3.7 in 2025. These scores imply significant reliance on emission estimates based on third-party emissions intensity factors rather than on actual customer disclosures. For both banks, aviation portfolio PDQS scores were better than average at 3.8 for Deutsche Bank and 3.0 for Barclays.
Figure 5. Selection of banks’ financed and facilitated aviation emissions, 2024
| Bank | Aviation Emissions (MTCO2e) | % of Total Financed Emissions | US$ Exposure (US$ billion) | % of Total US$ Exposure |
| ANZ Bank | 1.9 | na | 2.0 | 0.2% |
| Bank of America | 3.7 | na | 7.0 | 0.5% |
| Barclays Bank | 5.0 | 4.7% | 7.0 | 0.5% |
| BBVA | 1.5 | 0.7% | 0.8 | 0.2% |
| BNP Paribas | na | na | 7.0 | 0.9% |
| Citigroup | 4.9 | 2.5% | 9.7 | 1.2% |
| Commerzbank | 0.9 | na | 1.5 | na |
| Commonwealth Bank of Australia (CBA) | 2.2 | 9.9% | 4.2 | 0.4% |
| Deutsche Bank | 1.5 | 3.0% | 1.8 | 0.6% |
| HSBC | 3.4 | na | na | na |
| ING Group | 4.0 | 1.7% | 5.0 | 0.5% |
| JP Morgan Chase | 1.7 | na | 2.7 | na |
| MUFG | 14.0 | na | 15.0 | na |
| National Australia Bank (NAB) | 1.1 | 7.3% | 1.5 | 0.3% |
| Santander | 0.5 | 1.0% | 0.6 | na |
| Standard Chartered | 1.2 | 2.5% | 1.5 | 1.9% |
| TD Bank | 2.5 | 2.1% | 2.9 | 0.3% |
| Total Sample | 50.0 | 3.5% | 69.2 | 0.6% |
Note: figure reported in foreign currencies have been converted to US dollars based on exchange rates at the end of 2024. Source: Company reports.
Aviation financed and facilitated emission targets
Aviation typically generates 2-5% of a bank’s financed and facilitated emissions. This would be consistent with aviation’s total contribution of c.2.5-3% of global GHG emissions. In a survey of 17 banks that report their aviation financing and emissions, shown in Figure 5 above, aviation comprised an exposure of 0.6% of the bank sample’s total financings but generated 3.5% of their total financed and facilitated emissions in 2024.
Figure 6 below shows the aviation emission performance and 2030 targets of a selection of 24 banks around the world. Ishka, an aviation consultancy, had identified 38 banks in total that reported aviation carbon intensity targets as of July 2025 and more are likely to have started reporting since then. Most banks focused initially in 2019 to 2022 on the largest sectors, notably energy, power and manufacturing and subsequently on the smaller aviation and shipping sectors since then.
Most large European and US banks have targets in place for aviation. The banks in Figure 6 are the main lenders and arrangers of global aviation finance with a total exposure of over US$70 billion as of the end of 2024. Most of these banks have dedicated aviation departments in their commercial banking operations. Between them, this sample of banks financed and facilitated over 50 million tonnes of aviation emissions in 2024.
The main lagging banks so far in terms of developing financed and facilitated aviation emissions targets would appear to be those in Japan, China and emerging markets.
Figure 6. Selection of banks’ financed and facilitated aviation emission performance and 2030 targets
| Carbon Intensity (gCO2e/RTK) – Airlines Scope 1, Lessors Scope 3 | 2019 | 2023 | 2024 | 2030 Target | Reduction 2023-2030 | Scenario | Baseline Year |
| ANZ Bank | 902 | 797 | 870 | 667-758 | -5% – 16% | IEA NZE | 2019 |
| Bank of America | na | 865 | 833 | 639 | -26% | MPP PRU | 2021 |
| Barclays Bank | na | 882 | 866 | 741-785 | -11%-16% | MPP PRU | 2023 |
| BBVA | na | 1,060 | 1,040 | 850 | -20% | IEA NZE | 2023 |
| BNP Paribas | na | 904 | 894 | 785 | -13% | IEA NZE | 2022 |
| Caixabank | na | 1,154 | 990 | 710 | -28% | MPP PRU | 2022 |
| Citigroup | na | 901 | 897 | 773 | -14% | MPP PRU | 2023 |
| Commerzbank | na | 780 | 810 | 593 | -24% | IEA NZE | 2023 |
| Commonwealth Bank of Australia (CBA) | na | 1,030 | 930 | 760 | -26% | IEA NZE | 2023 |
| Credit Agricole | 1,003 | 863 | na | 750 | -13% | MPP PRU | 2019 |
| DBS Bank | 880 | 830 | 840 | 740 | -11% | IATA FNZ | 2019 |
| Deutsche Bank | na | na | na | na | na | MPP PRU | 2023 |
| HSBC | 840 | 747 | 737 | 709-776 | +4%-5% | IEA NZE | 2019 |
| ING Group | 902 | 844 | 861 | 681 | -19% | MPP PRU | 2023 |
| JP Morgan Chase | na | 940 | 777 | 625 | -34% | IEA NZE | 2021 |
| Lloyds Bank | 1,143 | 901 | 743 | 788 | -13% | IEA ETP | 2019 |
| Morgan Stanley | na | 870 | na | 663-759 | -13%-24% | MPP PRU | 2022 |
| MUFG | na | 830 | na | 710 | -14% | IEA NZE | 2021 |
| National Australia Bank (NAB) | 1,040 | 1,200 | 949 | 770 | -36% | ATAG | 2019 |
| Natixis (Groupe BPCE) | na | 870 | 859 | 750 | -14% | MPP PRU | 2022 |
| Santander | 925 | 830 | 780 | 617 | -26% | IEA NZE | 2019 |
| Societe General | 950 | 887 | 866 | 775-784 | -12%-13% | MPP PRU | 2019 |
| Standard Chartered | na | 782 | 771 | 773 | -1% | MPP PRU | 2021 |
| TD Bank | 880 | 860 | na | 800 | -7% | IEA NZE | 2019 |
| Sample Average | 946 | 897 | 859 | 731 | -18% |
Note: BBVA, Caixabank, CBA, DBS, ING, MUFG, NAB and TD Bank report carbon intensity per RPK, which the author has converted to RTK assuming one passenger plus luggage = 100 kgs. Deutsche Bank introduced targets for aviation in 2024 but carbon intensity figures are not disclosed. Santander dropped its 2030 target in its 2025 Annual Report but continues to monitor carbon intensity. Source: Company reports.
Only three banks have dropped their targets for aviation since the ceasing of NZBA – Scotiabank, Wells Fargo and Santander. Scotiabank and Wells Fargo dropped all of their sector financed emission targets but they have kept their own operations’ emissions targets. Santander dropped its aviation carbon intensity target for 2030 in its 2025 Annual Report on the basis that its exposure to aviation had declined significantly since it first announced its aviation target in 2019 and that achieving the target was overly dependent on policy and technology, over which it had little control. But Santander continues to monitor and report its aviation carbon intensity.
Banks’ targets for aviation financing centre entirely around carbon intensity, most commonly expressed as grams of CO2e per RTK, similar to how most airlines report carbon intensity.
Some banks report total financed and facilitated emissions by sector but for most sectors, except energy, they do not have absolute emission targets. This could expose them to ‘greenwashing’ accusations if their carbon intensity declines but absolute emissions increase because of increased financing activity, especially in a growing and capital-intensive sector like commercial aviation. But instead of curbing their lending to aviation in order to lower their overall emissions, banks rely on bringing down lending to fossil fuel sectors and on easier-to-abate sectors steadily reducing their emissions.
The sample average carbon intensity target for 2030 in Figure 6 is 731 gCO2e/RTK, which would be an 18% reduction compared to the most common baseline year of 2023 and an estimated 22% reduction compared to 2019 for the handful of banks that recorded aviation emissions in that year. These overall target reductions would be broadly consistent with those of major airlines.
Any 2030 carbon intensity target reduction greater than 25% compared to 2023 could be at risk due to new aircraft delivery delays, engine-related groundings and re-routings by airlines around Russia, Ukraine and the Middle East on flights to Asia. Air France-KLM, for example, recently missed its 2025 target linked to its €1 billion of sustainability-linked bonds issued in 2023, resulting in an additional €7.5 million of payments to bondholders. In its 2025 universal registration statement, published in February 2026, Air France-KLM lowered its 2030 carbon intensity target from 670 gCO2e/RTK (-28% versus 2023) to 763 gCO2e/RTK (-18% versus 2023), similar to that of the banking sample in Figure 6.
There are wide varieties of emission intensity performance and targets among the group of 24 banks in Figure 6. Actual carbon intensity performance in 2023 was an average of 897 gCO2e/RTK with a sample range of 747 to 1,200 gCO2e/RTK. The target range for 2030 is less wide at between 617 and 850 gCO2e/RTK with an average of 731 gCO2e/RTK. These wide ranges suggest differences in the scope of emissions covered (some banks exclude aircraft lessors’ emissions), the composition of aviation finance portfolios in terms of aircraft types and age and the mix of passenger and freight tonnage in the RTK calculation. Despite being the same weight, a tonne of freight generates less fuel consumption and fewer emissions than a tonne of passengers and their luggage because passengers require more support and heavier infrastructure than cargo in terms of cabin crew, seating, air conditioning, catering and sanitation. Some banks exclude air cargo from their emissions targets.
Typically, banks report and target just the Scope 1 emissions of airlines and the Scope 3 emissions of aircraft lessors, which are effectively the Scope 1 emissions of lessors’ airline customers. Scope 2 emissions are relatively minor at around 0.1% of an airlines’ and lessors’ total Scope 1 to 3 emissions. Airlines’ Scope 3 emissions are more significant at c. 30% of an airline’s total emissions but are typically only reported by those airlines that are publicly listed and involve a high level of estimations and assumptions.
Some banks also measure and target the proportion of their aviation financing to acquire and operate new generation aircraft (A220, A320neo family, A330neo, A350, ATR 42/72, B737MAX, B787, B777-8 and -9 and E190-E2), which are typically 15% to 25% less emitting and more fuel efficient than their predecessor generation. A typical target is 80-90% of their aviation portfolios by 2030 compared to c.70% in 2023 and c.25% in 2019.
It is important to note that banks’ aviation emissions targets are based on gross emissions and not net emissions. They do not take into account offsets, such as emissions covered by ETS allowances and CORSIA credits. The reason is not because they do not value these offsets. It is because of double-counting concerns if they did track net emissions. ETS, for example, involves the purchase of credits by airlines from other sectors, which have reduced their gross emissions. If a bank provides loans to airlines as well as companies in sectors that sell ETS allowances, it would double-count its financed emission reductions if it added the gross emission reduction of companies that sell ETS allowances to the net emission reduction of its airline clients or other sectors that purchase ETS allowances.
How banks monitor climate alignment of aviation portfolios
According to UNEPFI guidelines, all banks’ climate targets and financed emissions pathways should be science-based and using a recognised pathway scenario to net zero by 2050. All targets should be verified by third parties. Figure 6 shows the reference scenario selected by each of the 24 featured banks.
For aviation, the most common reference scenario used by financial institutions is the Mission Possible Partnership (MPP) ‘Prudent’ scenario. Other scenarios used include the IEA NZE 2050 for aviation, the Air Transport Action Group (ATAG) Waypoint 2050 and the IATA Finance Net Zero (FNZ). Several banks have switched from IEA NZE to MPP, such as ING Group of the Netherlands. These banks made the switch for three reasons. First, MPP measures emissions on a ‘Well to Wake’ (WTW) basis and therefore takes into account the lower lifecycle emissions of sustainable aviation fuel (SAF) whereas IEA NZE measures emissions on a ‘Tank to Wake’ (TTW) basis. Second, MPP is focused entirely on commercial aviation whereas IEA NZE also includes military aviation. Third, some banks have commented that MPP more accurately accounts for the emissions of air cargo. The two different approaches also partly explain the differences between banks in carbon intensity performance and targets in Figure 6.
MPP is an alliance of climate leaders focused on accelerating the decarbonisation of the hardest-to-abate sectors – aviation, shipping, trucking, steel, aluminium, cement/concrete and chemicals. MPP is led by the Energy Transitions Commission (ETC), Rocky Mountain Institute (RMI), the We Mean Business Coalition (WMBC) and the World Economic Forum (WEF). MPP’s scenarios for aviation emissions have been endorsed by 69 airlines, aerospace, fuel suppliers and other aviation related companies worldwide.
The MPP ‘Prudent’ scenario, often known as ‘MPP PRU 1.5’, was first developed in 2022. It achieves alignment with the Paris Agreement’s 1.5oC target and net zero emissions by the commercial aviation sector by 2050. The main drivers of emission reduction are aircraft and air traffic control technology and efficiency improvements and sustainable aviation fuel (including synthetic e-SAF), followed by new battery-electric and hydrogen fuelled aircraft and carbon removals. This is consistent with the pathways to net zero by 2050 that most major airlines have developed.
The scenario involves carbon-neutral growth for the airline sector up to 2030, despite annual capacity growth, based on historical efficiency gains of 1% per year, additional efficiency gains of another 1% per year and high abatement costs of US$200-600 per tonne of CO2 due to rising ETS and CORSIA costs and the higher cost of SAF and e-SAF comprising 10% to 15% of total fuel consumption by 2030.
The period of the ‘Prudent’ scenario to 2030 may be currently in doubt, however, due to the slow development of SAF, especially e-SAF, and the slower-than-expected output of new technology aircraft by Airbus and Boeing due to supply chain constraints and new engine shortages. The SAF penetration of total fuel needs might not even get as high as 5%, let alone MPP’s 10% to 15% assumption, and compares to only 0.7% in 2025 and an expected 2% in 2026.
Pegasus Guidelines
Many banks have also adopted the ‘Pegasus Guidelines’, which were developed in 2024 by the Center for Climate-Aligned Finance for the Rocky Mountain Institute (RMI) and five launch banks (BNP Paribas, Citigroup, Crédit Agricole CIB, Societe Generale and Standard Chartered Bank). These guidelines are also based on the MPP ‘Prudent’ scenario and had been endorsed by the NZBA, now UNEPFI. These guidelines are a voluntary standard for financial institutions to independently measure and disclosed the emissions intensity of and the climate alignment of their aviation lending portfolios to a 1.5oC roadmap.
These guidelines are used by lenders to benchmark their portfolios against the relevant sector science-based net zero trajectories.
Pegasus has a nine-step methodology for banks to follow:
- Identify in-scope clients and their financings. In-scope clients include airlines and aircraft lessors. In-scope financings include on-balance-sheet products (loans, bonds and equity stakes at book value), committed credit facilities (drawn plus undrawn commitments) and uncommitted credit facilities (outstanding utilised amount only).
- Identify aircraft-specific financings and general-purpose financings. The emissions intensity of aircraft-specific financings should be based on the average emissions and traffic of the relevant aircraft type of the aircraft operator client across its fleet. It should not be based on the specific emissions intensity of that specific aircraft’s manufacturer’s serial number (MSN) nor on the average emissions intensity of the airline. This approach prevents distortions due to maintenance timing, cabin configuration and route assignment. For general-purpose financings, emissions intensity should be based on the average across its total operated fleet (for airlines) or owned fleet (for lessors).
- Measure baseline emissions in tonnes of CO2e by multiplying fuel tonnes by 3.84 grams per gram of fossil jet fuel. This calculates the Wake to Well (WTW) life-cycle emissions, which is consistent with SBTi’s guidance for the aviation sector. This is higher than the 3.16 grams of jet fuel for Tank to Wake (TTW) emissions, which the IEA NZE scenario uses.
- Account for SAF purchases by calculating the emissions reduction resulting from the purchase of SAF and then subtracting from baseline emissions. This must be done separately for each type of SAF because different types have different WTW emission reductions.
- Measure traffic in terms of RTKs by calculating cargo RTKs and converting passenger RPKs to RTKs by a factor of 100 kg per passenger, including luggage.
- Calculate emissions intensity of each financing.
- Calculate portfolio-level weighted average emissions intensity. The weighting is according to the value of each financing.
- Calculate the benchmark emissions intensity, customised to each user based on the MPP ‘Prudent’ scenario roadmap. This is typically based on a linear trajectory towards the bank’s target for 2030 for its aviation lending activities from its baseline year. See Figure 4 for an example of Barclays Bank and Figure 7 for an example of ING Group.
- Calculate the Portfolio Alignment Score (PAS), which can be expressed as a number or a percentage. If the PAS is negative or zero, the portfolio is aligned to a 1.5oC trajectory. If the PAS is positive, the portfolio is not aligned to a 1.5 oC trajectory, in which case the bank will need to take some portfolio actions to bring it back in line by 2030.
ING Group example
Figure 7 is an example of how banks report the climate alignment of their financed and facilitated emissions for the aviation sector, taken from ING’s recently published annual report for 2025. ING’s original baseline in 2019 was a carbon intensity of 902 gCO2e/RTK. It established a new baseline in 2023 of 844 gCO2e/RTK after adopting the MPP PRU and Pegasus Guidelines. Its carbon intensity target for 2030 is 681 gCO2e/RTK, a 19% reduction compared to the new baseline in 2023.
For 2024, it calculated aviation carbon intensity of 861 gCO2e/RTK, a 2% increase on 2023, mainly due to the repayment by customers of significant financings of new generation aircraft. According to ING’s pathway to 2030, the portfolio should have achieved an intensity of c.840 gCO2e/RTK in 2024 (author’s estimate of the portfolio benchmark from the chart in Figure 7). The estimated Portfolio Alignment Score (PAS) was therefore (861-840)/840 = +2.5%. Being positive, the PAS score indicates that the portfolio is not on track to achieve its target of 681 gCO2e/RTK by 2030 and therefore not aligned to the climate goal of 1.5oC. This is despite the proportion of new generation aircraft in its portfolio increasing from 71% in 2023 to 77% in 2024. To achieve its 2030 target it will need to reduce its carbon intensity by 21% compared to 2024.
Figure 7 also indicates that ING’s aviation portfolio has a lower carbon intensity than the global average for ING’s portfolio composition (the light blue line), despite becoming less climate aligned in 2024.
Figure 7. ING Group – Aviation portfolio carbon intensity, 2019-2030
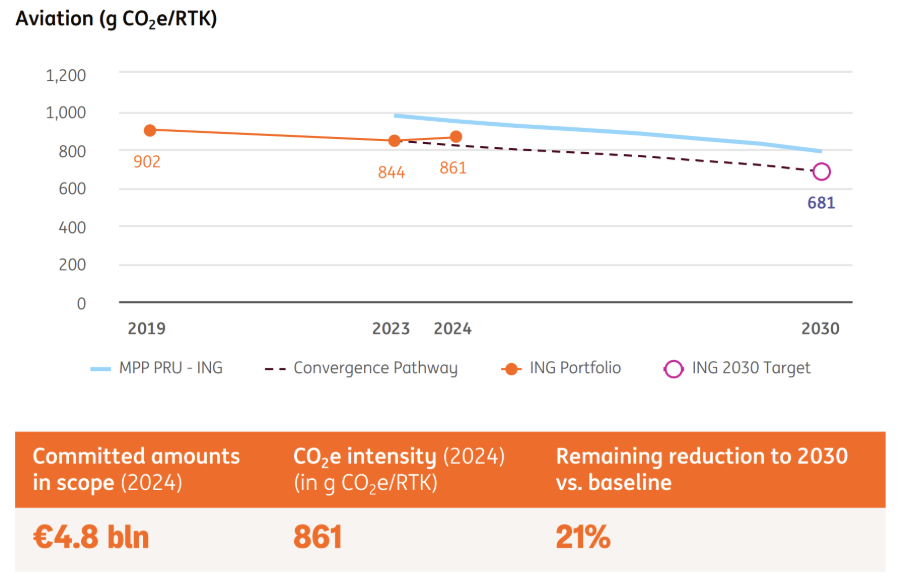
Source: ING Group Annual Report 2025
How banks make climate assessments of aviation customers
Once a bank has determined the climate alignment of its aviation portfolio, it then assesses what actions it needs to take to ensure continued alignment or realignment. In the case of ING Group in the above example, it will need to take actions to bring the carbon intensity of the portfolio back down to its convergence pathway set in 2023.
Unlike aircraft lessors and investment managers, it is impractical for banks to improve their carbon intensity by selling their loans or demanding early repayment. Not achieving an airline’s carbon intensity target or its progress towards the target are generally not causes for default of a loan, although non-achievement of a carbon intensity target can be a reason for a higher interest rate or higher principal repayment in the case of a sustainability-linked loan.
If a bank determines that its aviation portfolio is over-emitting and therefore at risk of not achieving its 2023 target, one option is to stop new lending and run-off the portfolio until all loans have been repaid at expiry. This is rare for an aviation loan portfolio but it is common in the fossil fuel sector, where many banks are phasing out their lending by not rolling over existing loans when they mature.
To control the carbon intensity of its portfolio, the only realistic levers a bank has are to increase lending to existing lower emitting customers, for example with new generation aircraft on order, and to select new low emitting customers, for example, low cost airlines with young aircraft and high-density seat configurations.
In selecting their clients, banks typically undertake a climate risk assessment of each one. This climate risk assessment is in addition to the conventional credit risk, ‘know your customer’ (KYC) and other due diligence checks that a bank typically conducts prior to doing business with a new customer. This typically involves assigning customers a climate-based score. In the case of ING Group, the bank determines a Client Transition Plan (CTP) score out of 100 for each major customer based on their emission reporting, net zero commitments and targets, action plans and their environmental governance.
This scoring system serves multiple purposes:
- It helps the bank to steer its aviation portfolio towards customers with higher scores and away from those with lower scores by not renewing business.
- It helps target engagement with customers.
- It creates a climate risk-based model enabling risk assessment of a bank’s aviation portfolio in comparison to other sectors.
- It sets a risk appetite limit on how much business it can do in high emitting sectors.
Six requirements for airlines and lessors to maximise their climate assessment scores, minimise their climate risks and attract favourable financing terms
A high climate assessment score will increase the prospects of an airline or aircraft lessor securing better rates and financing terms for its borrowing requirements. A high score would also make an airline or lessor eligible to access sustainability-linked loans and credit facilities on even better terms to regular aviation finance.
In order to achieve a high climate assessment score, a customer must demonstrate the following six requirements:
- Materiality assessment of climate risks in terms of ‘financial materiality’ (how sustainability matters affect company performance and prospects) and ‘impact materiality’ (the impact of the company on all stakeholders and society), often known as a ‘double materiality assessment’ (DMA) of risks and opportunities. This is already required by the European Union’s Corporate Sustainability Reporting Directive (CSRD). Other countries outside the EU have similar requirements for the reporting of non-financial information, including environmental risks and opportunities. The more onerous requirements of the EU’s Corporate Sustainability Due Diligence Directive (CS3D) and EU Taxonomy are not required by most banks because CSRD suffices.
- Commitment to aligning with the Paris Agreement and to net zero emissions by 2050 for at least their Scope 1 emissions or Scope 3 emissions in the case of aircraft lessors. Listed airlines typically have an explicit roadmap to net zero emissions by 2050. But best practice for every airline is to have such a roadmap if they are serious about attaining net zero.
- An interim target for at least 2030 that is consistent with the bank’s own carbon intensity reduction target for the aviation sector in terms of both absolute carbon intensity and the percentage reduction.
- Action plans to execute its roadmap to lower emissions. These include fleet plans, plans to reduce fuel consumption via efficiency initiatives and sustainable aviation fuel (SAF) plans, offtake agreements and investments in SAF and carbon removal projects.
- Adequate governance in place to manage climate risks, such as the existence of a Board sub-committee focused on sustainability and climate issues, internal controls and a manager or management team tasked with addressing fuel consumption and emissions. This test is to ensure that climate change issues are integrated into strategic planning and decision-making.
- Business processes, methodologies and systems in place to measure their emissions and monitor their performance.
Customers can present these requirements using one or a combination of the many frameworks that are available, such as TCFD (Task Force on Climate-related Financial Disclosures), CDP (Carbon Disclosure Project), Transition Pathway Initiative (TPI) and IATA’s GRI (Global Reporting Initiative) standards.
Best practice is to produce a Sustainable Finance Framework, as shown in Figure 8, especially if an airline or lessor would like to attract sustainability-linked financing. Good examples of a Sustainable Finance Framework are those of Air France-KLM, Japan Airlines and Volaris. Banks offer sustainability-linked loans because of their direct linkage to their own carbon intensity targets, unlike regular loans, and they are financially compensated should an airline not achieve its carbon intensity target..
The recently introduced EU Taxonomy to aviation, however, is not a useful framework of an airline’s risks and opportunities and is the most onerous framework to comply with. The taxonomy essentially penalises the aviation sector for being high-emitting by incentivising the global aircraft fleet not to grow. Also, the format of its output is not user-friendly. It has been widely criticised by airlines, investors and banks, especially regarding aviation climate risk assessment.
Generally, airline customers must demonstrate commitments to these requirements even though they may not yet have them in place. Listed airlines and aircraft lessors are normally required by stock exchange regulation to have these in place as a minimum already.
Any external audit or verification of the above requirements would enhance a customer’s climate assessment score, as would their addressing of their Scope 2 and 3 emissions. CDP, TPI, MSCI and Sustainalytics all assess companies’ climate and sustainability credentials and provide scores that are useful to banks in making climate risk assessments.
In the case of ING, it bases its client CTP scores with a 25% weighting towards emission reporting, 10% weighting to commitment to net zero emissions by 2050, 35% weighting to an interim target for 2030, 20% to an action plan and 10% to a customer’s governance. Emissions reporting, 2030 interim targets and action plans are therefore the most important drivers of a customer’s CTP score, while commitment to net zero by 2050 and governance, although very important, carry less weight.
ING has grouped its 2,000 corporate banking clients into three bands: (i) ‘advanced’ (score of at least 60%); (ii) ‘average’ (30-60% score); and (iii) ‘low’ (below 30%). Most companies with publicly listed equity or bonds are in the ‘advanced’ customer band because of their required carbon disclosures.
Finally, most banks like to source their information from public sources rather than from private sources. Filling in questionnaires can be subjective while publicly available data is subject to external scrutiny and can influence the reputational risk of a company. Banking regulators also prefer their banks to use public data, especially if they are audited or verified. Private data is welcome as long as it is not price sensitive (for a company with publicly listed shares or bonds). Even if they are not listed, companies are encouraged to publish their climate commitments, targets, performance and action plans, for example on their websites and in their annual reports or financial reports to Government regulators, such as Companies House in the UK.
Implications for airlines and lessors
Knowing how banks assess their own climate alignment and risks and those of their customers has important implications for airlines and lessors. Figure 8 at the end of this article shows a comprehensive sustainable finance framework and checklist that can be useful to put together all of the data and action plans that banks require in order to make climate assessment scores of their customers as well as to set the terms of the financings that they can provide to them.
This checklist will help airlines and lessors prepare for discussions with their banks and secure the most favourable funding terms by helping banks achieve their own climate goals. The checklist framework has four major sustainability aspects – sustainability strategy and governance, sustainability costs, a sustainable financial framework and details of specific financing transactions.
- Sustainability strategy and governance, including roadmaps to net zero, interim 2030 targets for carbon intensity and an organisation structure and processes to manage the transition.
- Sustainability cost budget, including capital spending plans on new technology aircraft, SAF blending targets, offtake agreements and expenses and expected costs of ETS and CORSIA compliance up to 2030.
- Sustainable financial framework, including rationale for financing, adherence to sustainability principles, linkages of financing terms to sustainability performance targets (SPTs), performance reporting and verification.
- Specific financing transaction details, terms and documentation.
Figure 8. Sustainable Finance Framework Checklist for Airlines and Lessors
| Sustainability Strategy and Governance | Issuer’s sustainability strategy: Corporate purpose Materiality assessment of business model and key sustainability issues and risks (large and listed companies only and if available) Climate transition strategy Other ESG objectives (if appropriate) |
| Roadmap(s) to net zero emissions by 2050: Scope 1 Scope 3 (if appropriate) Carbon removals (if appropriate) | |
| Intermediate targets by year up to 2030, every 5 years to 2050: Carbon intensity Percentage next generation aircraft in fleet (if appropriate) Percentage SAF uplift (if appropriate) Other ESG targets (if appropriate) | |
| Scientific validation of alignment of roadmaps and targets with the Paris Agreement | |
| Sustainability governance – roles of Board, Board sub-committee, CEO, management committee, ESG team and incentives | |
| Disclosure frameworks (if available and if required to be reported) – e.g. TCFD | |
| Sustainability Cost Budget | Capital spending by year to 2030: New technology aircraft Electric ground vehicles Project investments (SAF, Carbon removals) |
| Operating expenses by year to 2030: Total fuel costs – jet fuel and SAF Emission costs – EU ETS and other ETS schemes Emission costs – CORSIA | |
| Sustainable Financing Framework | Rationale for financing and use(s) of proceeds |
| Relevant financing principles: LMA SLPs and GLBs ICMA SLBPs and GBPs Other country or region-specific principles/taxonomies | |
| Selection of key performance indicator(s) (KPIs): Metric(s) Scope Methodology for calculation and sources of data Alignment with relevant UN SDGs and other country or region-specific ESG objectives | |
| Calibration of sustainability performance target(s) (SPTs): Historical performance by year Baseline year selection and rationale Future targets by year or every 5 years Strategies and action plan to achieve SPT(s) Key risks to achieving SPT(s) | |
| Characteristics of the financing: Target determination dates/years for SPT(s) Linkage of interest rate, fees and principal repayments to SPTs Recalculation policy of baseline and/or SPT(s) in the event of unforeseen major events/changes | |
| Performance reporting process: Relevant information to be reported Frequency of reporting Disclosure of reports (e.g. annual report, website) | |
| Verification: Identity of third-party verification (second opinion) providers Verification of framework’s alignment to financing principles and contribution to sustainability Post-issuance verification of performance to SPT(s) | |
| Specific Financing Transaction | Amount and use(s) of proceeds |
| Formula linking interest rate, fees and principal repayments to SPTs | |
| Covenants | |
| Term Sheet (non-binding) | |
| Loan or Facility Agreement (binding) | |
| Finance, JOLCO or Operating Lease Agreement | |
| Other documentation – e.g. syndicated loan agreement, underwriting agreement, bond indenture, global note, paying agency agreement, legal opinion, auditor comfort letter, etc. | |
| Prospectus or Offering Circular (for bonds and listed securities) |